2.5- Application Service Verification
With the applications successfully deployed and running, we moved on to verifying NCE-Fabric’s ability to monitor the services and evaluate risks. This test focused on NCE-FabricInsight, a standalone component specialized in monitoring and analysis.
NCE-FabricInsight provided a network-wide risk overview. The displayed risks were not limited to application-level issues but included general network risks.
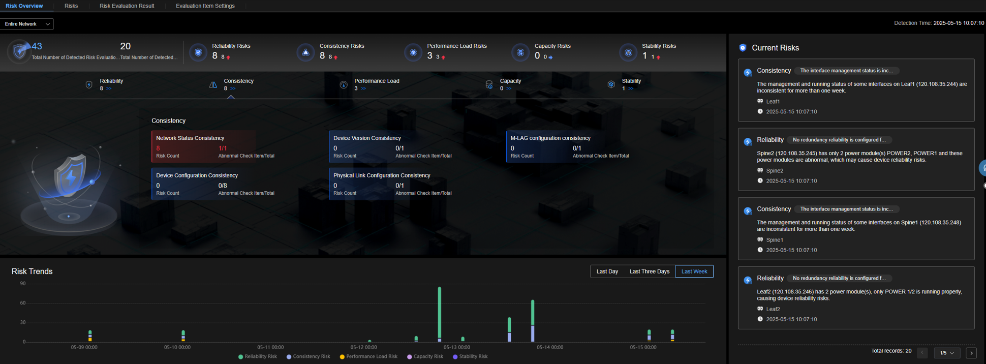
Figure 22: Risks Overview
The risks were categorized into five areas: reliability, consistency, performance load, capacity, and stability. In our test, the detected risks included redundancy issues related to power supply units and physical interfaces on certain devices that were operationally down but administratively up. An additional risk was related to load balancing. NCE-FabricInsight detected uneven traffic distribution across uplinks and suggested a general handling action, such as optimizing the hashing algorithm.
However, this risk was triggered by a reported 100% utilization on interface 100GE1/0/2 of Leaf2 over an extended period. At that point, no traffic was being generated into the fabric, so such high utilization was unexpected. Huawei later confirmed that this was a known issue in that version of NCE and that it had already been resolved in a newer version. Another risk reported by NCE-FabricInsight was about missing Layer 3 interfaces between a leaf switch and Spine1. This was due to unused connected links.
To verify NCE-FabricInsight’s ability to detect service-level issues and analyze end-to-end communication paths, we introduced a routing black hole on Spine2. This fault was intended to disrupt traffic to an endpoint connected to Leaf3. We generated iPerf traffic between virtual machines on Leaf2 and Leaf3, ensuring that the traffic would flow over the affected path. NCE-FabricInsight detected the issue and produced a detailed analysis. It identified the impacted IP addresses and highlighted the route causing the disruption. Additionally, the platform presented an end-to-end path view showing the health status of each segment, the failure domain, and the suspected root cause of the interruption.
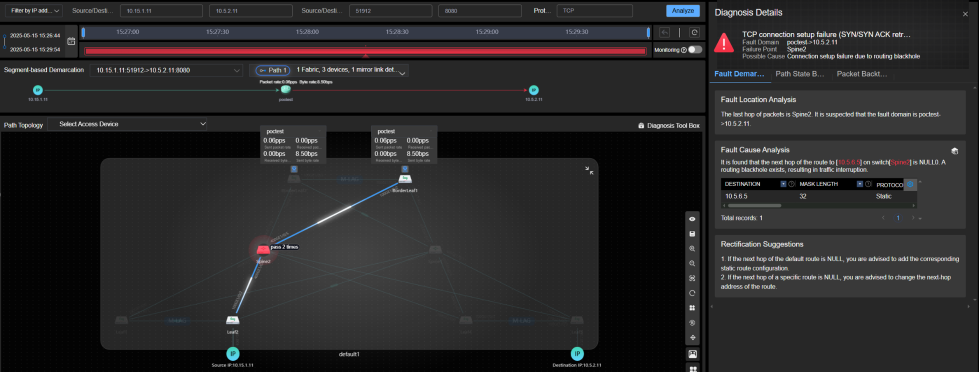
Figure 23: End-to-End Path Diagnostic View
In the application health status overview, the affected services were highlighted, showing the issue in the path between them, as shown in Figure 24 below.
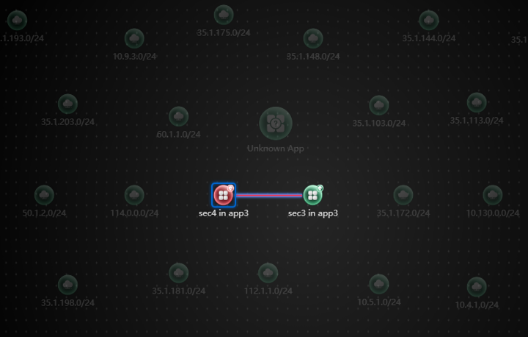
Figure 24: Service-Level Health Status Overview
Selecting the icon for sec4 in app3 (Security Zone 3 in Application 3), shown in the previous figure, provided more detailed information about the health status of the security zone and the nature of the detected issue. NCE-FabricInsight marked the application state as an "Exception," indicating the presence of one issue. The health trend timeline clearly showed when the disruption began. The reported issue was related to connection setup, with a 0% connection success rate during the observed interval and a 100% server no-response rate.
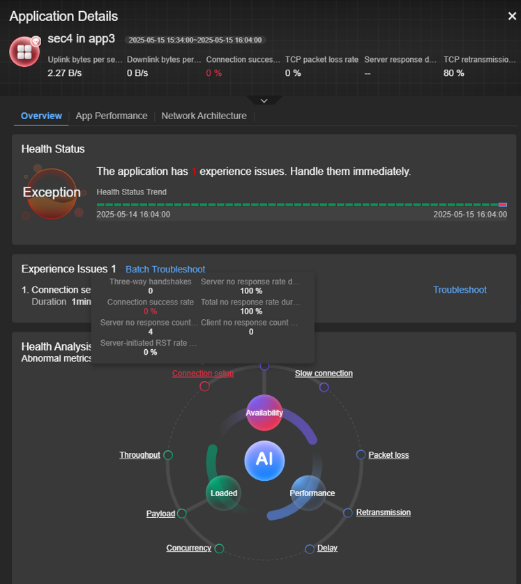
Figure 25: Application Health Status
The results of this test verified NCE-FabricInsight’s ability to monitor application services, detect service-level issues, and evaluate network risks in real time. Its diagnostic capabilities and end-to-end path visibility fulfill the Level 4 requirements for the Verification capability, as defined in ETSI GR ENI 049.
| < Previous | Next > |